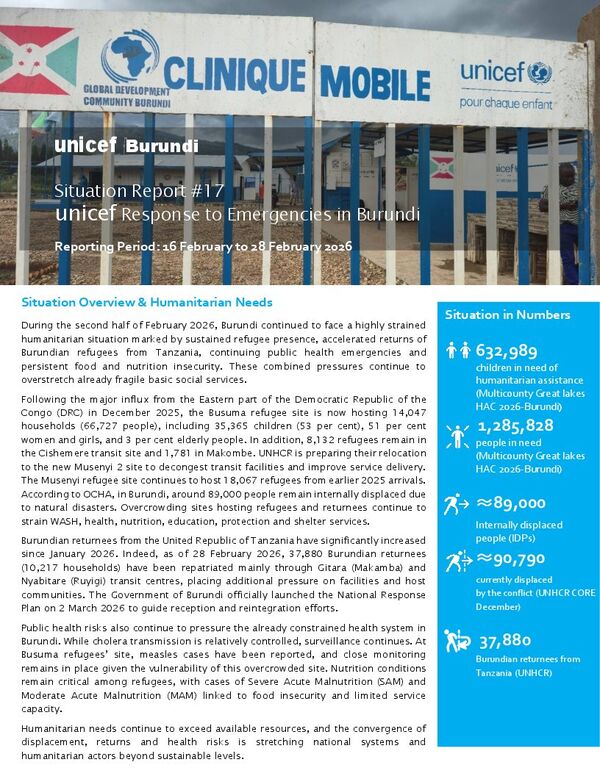
UNICEF Burundi Humanitarian Situation Report No. 17, February 2026, PDF, 725 KB (new window)
United Nations Children's Fund (UNICEF)

National reference platform
47 official indicators, validated and sourced, for six systems: nutrition, health, water and sanitation, food, education and social protection.
IPC alert, phase 3 or above
14,0%
of the population in acute food insecurity, April-May 2026
Down 2,0 pts compared with H2 2025. Favourable change. since H2 2025
Read the IPC analysis (new window)52,8%
Down 3,1 pts compared with 2023. Favourable change. 2023: 55,9 %
8,0%
Up 2,0 pts compared with 2023. Unfavourable change. 2023: 6,0 %
65,9%
Up 0,1 pt compared with 2023. Favourable change. 2023: 65,8 %
83,3%
Down 0,3 pt compared with 2018. Unfavourable change. 2018: 83,6 %
Data in focus
The national value went from 57,0 % in 2018 to 52,8 % in 2024. Depending on the province, it ranges from 28,3 % in Bujumbura Mairie to 65,1 % in Gitega.
Stunting among children under 5 years
Percentage, official national value
By province, 2024
Six systems, one common framework


Dashboard
Choose an indicator and a period: the map, the ranking and the national series update together. Each indicator sheet opens without leaving the dashboard.
National28,6 %
Darker: more favourable situation
Source : ENSNMB 2024 (SMART) (new window)
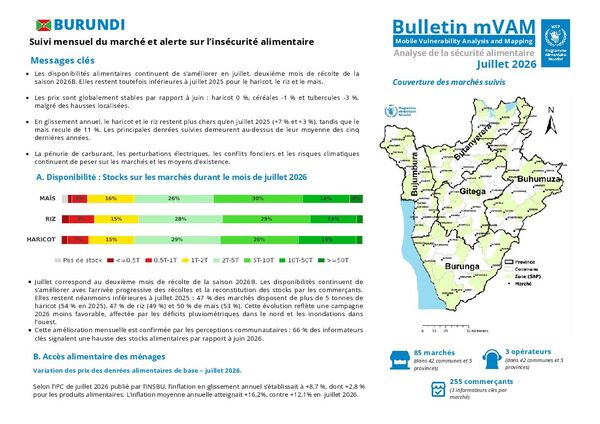
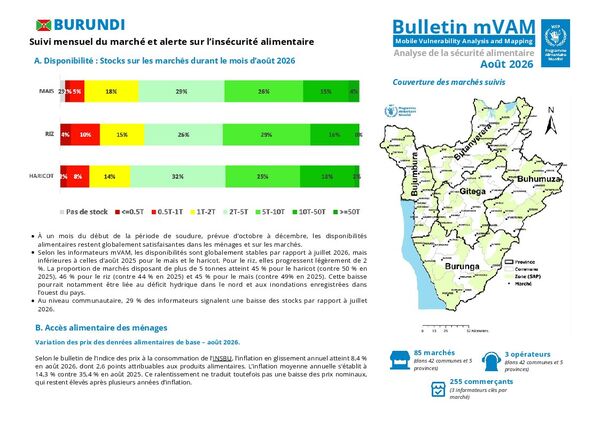
Food prices
1 450BIF/kg
Down 6,6 % compared with July 2025. Favourable change. over one year
2 000BIF/kg
Up 1,8 % compared with July 2025. Unfavourable change. over one year
2 867BIF/kg
First reading
1 567BIF/kg
Down 4,8 % compared with July 2025. Favourable change. over one year
Source : WFP, 29 markets (new window)
A price decrease is favourable to buying households.
Reading
United Nations Children's Fund (UNICEF)
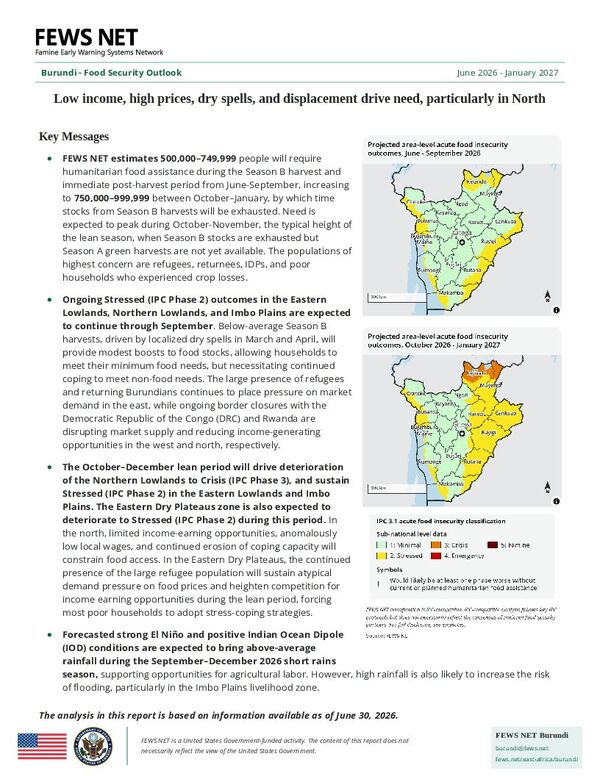
Famine Early Warning Systems Network (FEWS NET)
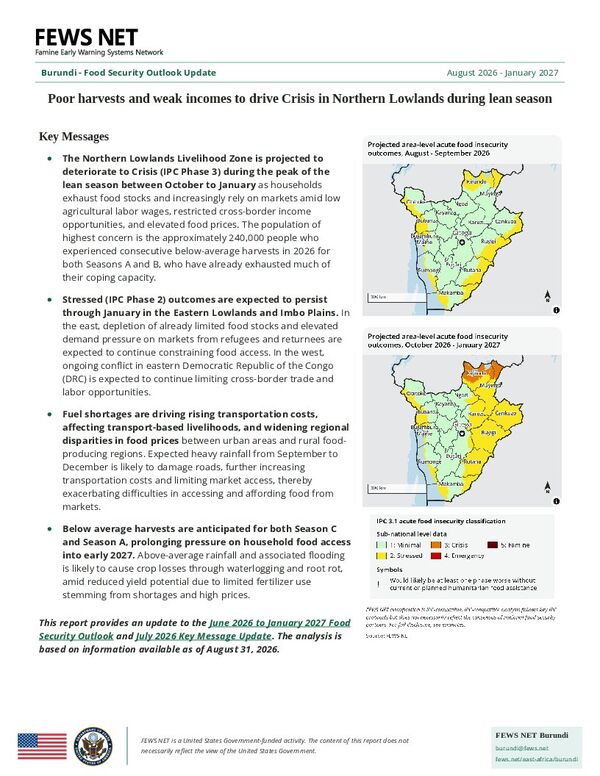
Famine Early Warning Systems Network (FEWS NET)
World Food Programme (WFP)
World Food Programme (WFP)
World Food Programme (WFP)
New version available.
Save the entry in progress first. Your pending entries stay on the device.

Install the application
On iPhone: tap Share, then Add to Home Screen.
Open the indicators from your home screen, even without a network.